Everyone who runs a website has lived this moment at least once: you learn that your product is down from a customer email, a tweet, or a friend asking "is it just me?". Uptime monitoring exists so that never happens, and the category is crowded. But for a growing number of European teams, picking a tool now comes with a second question: where does all of this run, and who ends up processing the data about my infrastructure and my users?
Phare answers that second question very directly. It's an all-in-one platform for uptime monitoring, alerting, incident management and status pages, and it's built, hosted and incorporated in the European Union, down to the AI model that writes its incident summaries.
I didn't want to review it from the marketing site, so I went hands-on. I created a project on a real account, monitored the Uneed homepage, broke a monitor on purpose to trigger a real incident, published an update to a public status page, and scheduled a maintenance window. I also had a head start: my co-founder Hugo has been monitoring Writizzy with Phare since late August, so I could look at a couple of months of real production data too.
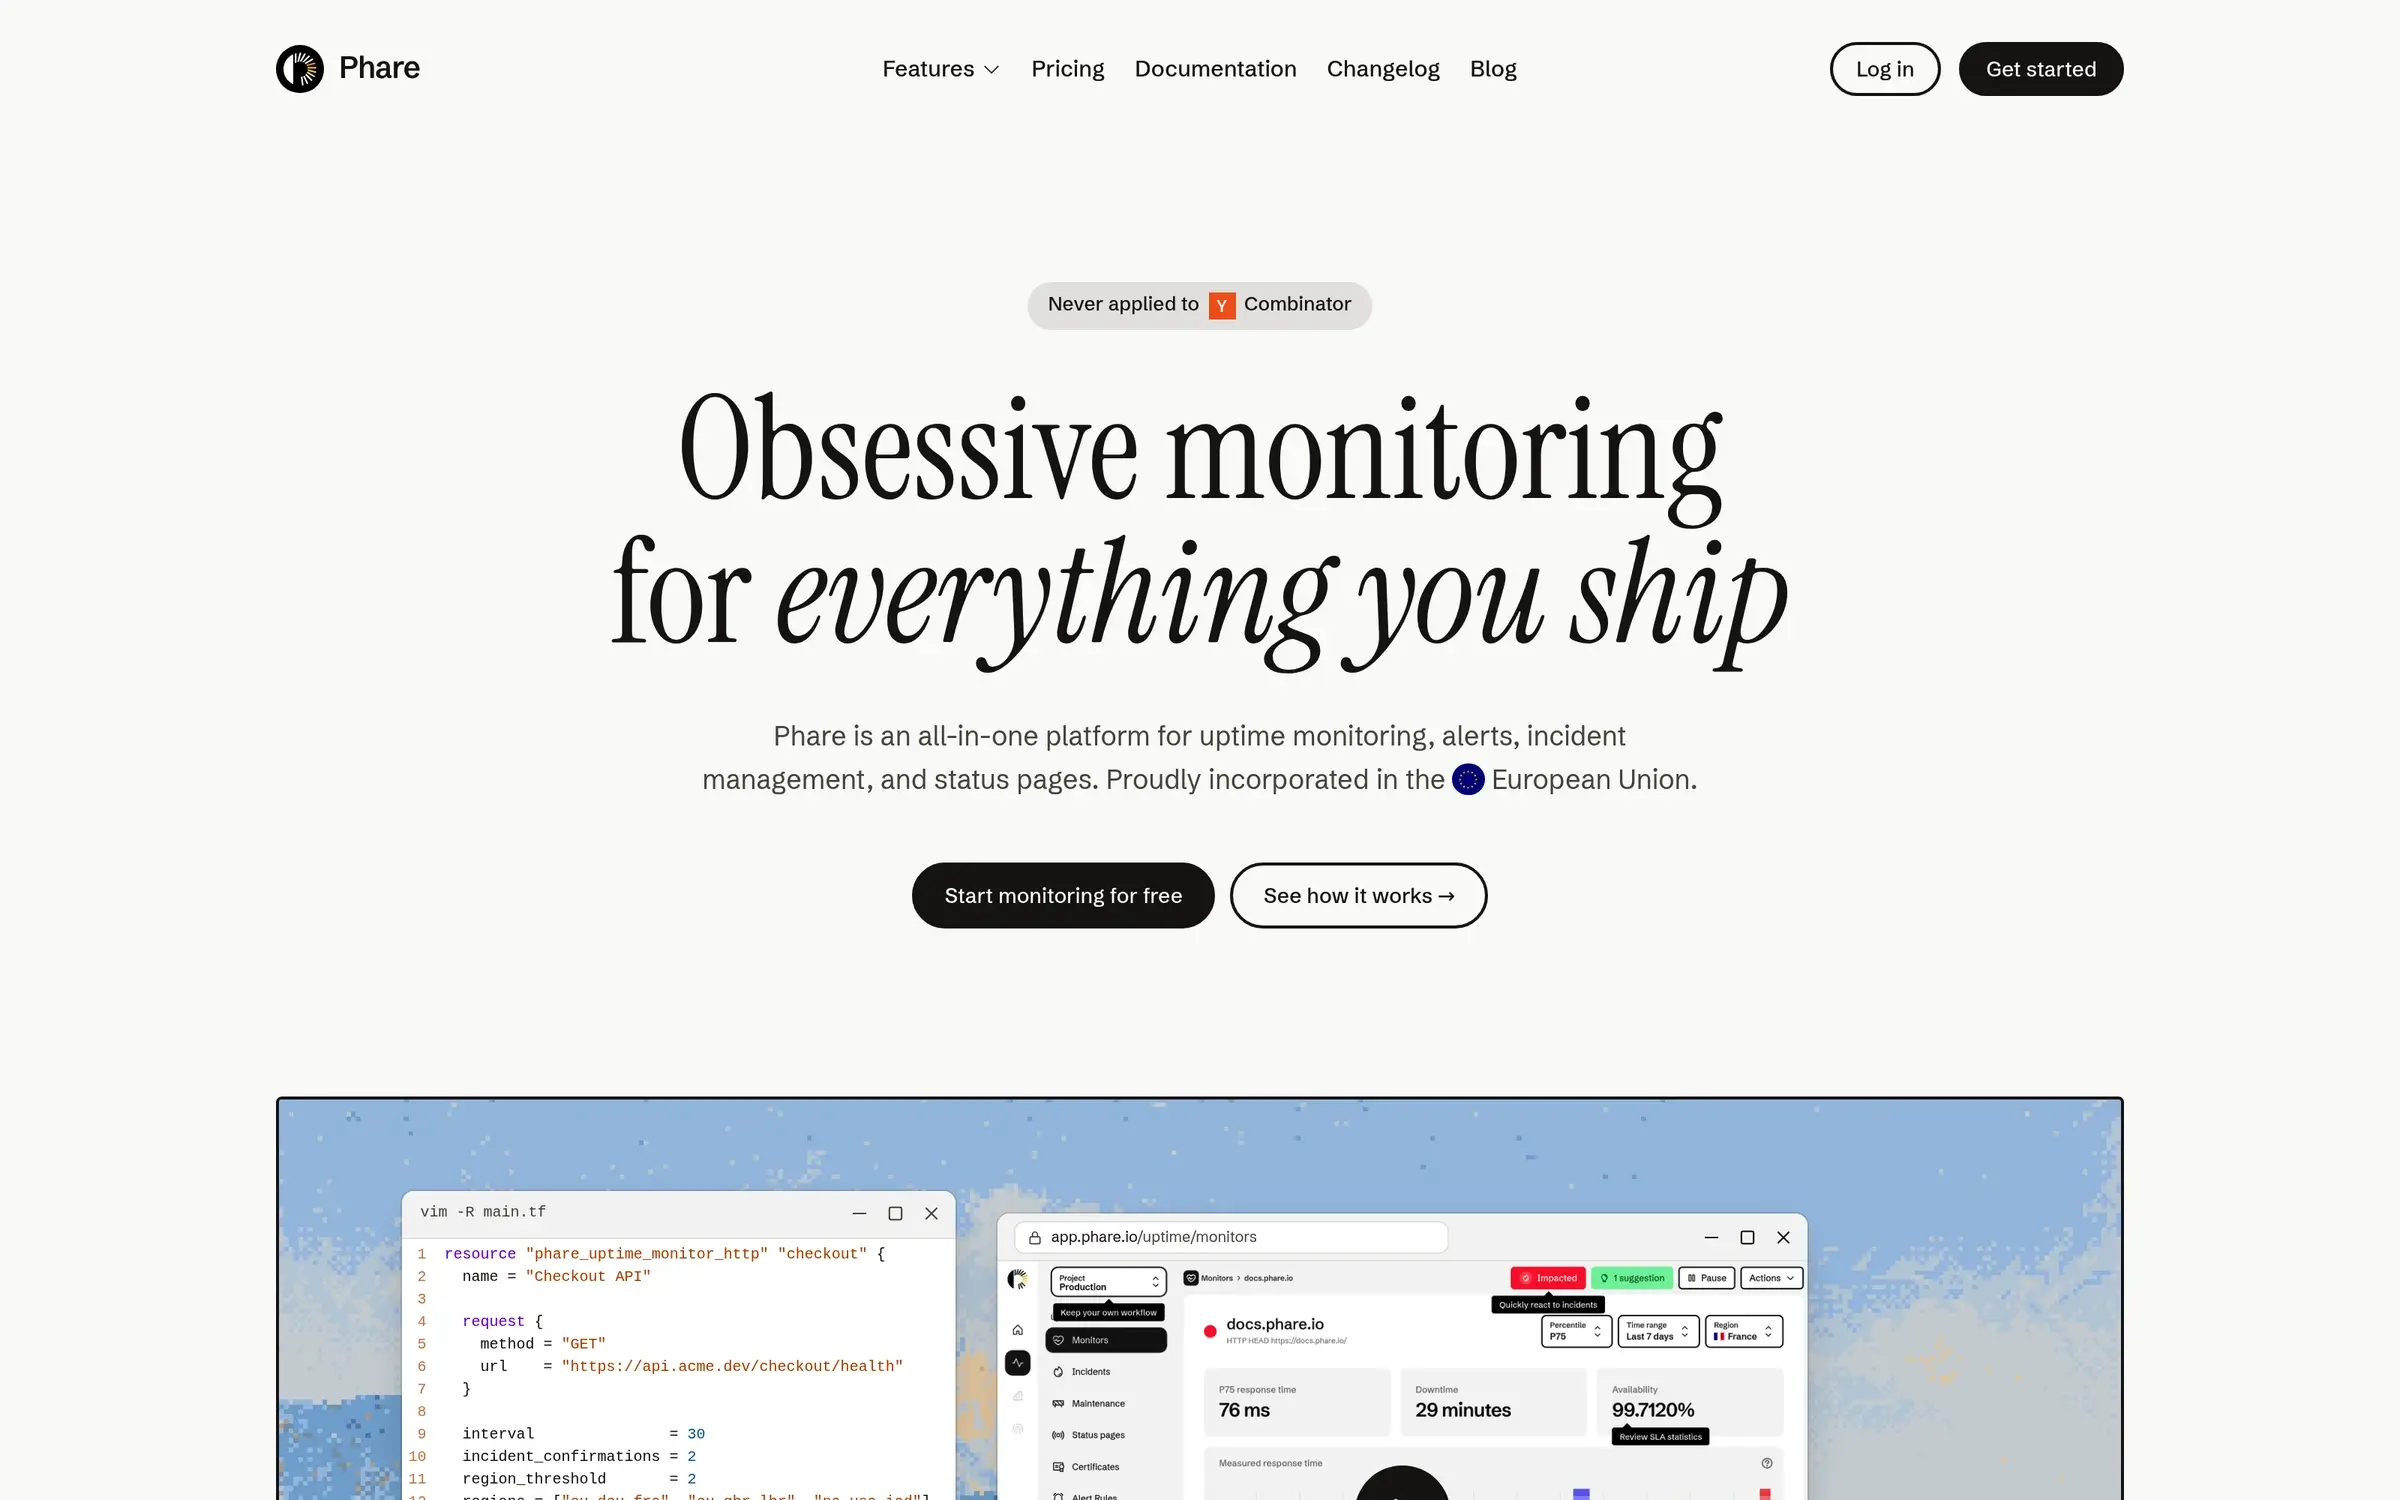
The Phare home page: uptime monitoring, alerts, incident management and status pages, incorporated in the European Union.
This is the angle Phare leans on, and it's more concrete than a flag in the footer. Phare names its providers: servers at Hetzner in Germany, a CDN from Bunny.net in Slovenia, and emails sent through Scaleway in France. The incident AI runs on Mistral, the French model provider, and the docs say sensitive values like monitor names, API keys, header values and user emails are redacted before anything is sent. A data processing agreement has been available since June 2026.
I can't audit someone else's servers, so I'll take the hosting list as Phare's own statement. The lightweight side, on the other hand, is checked by a third party: the Website Carbon Calculator gives Phare's status pages an A+, with less than 0.01 g of CO2 per visit in its October 2026 test. The status page I created for this review loaded in 7 requests and about 17 KB, which lines up.
One more thing I appreciated: Phare publishes its numbers. Its open metrics page lists revenue, costs and usage, and in November 2026 it showed 75 paying customers, about €456 of monthly revenue against roughly €113 of costs, 4,084 active monitors and 750 hosted status pages. That's a company that is profitable on paper and very transparent about it. It's also a small one, which some buyers will want to weigh.
Everything in Phare lives inside projects. I created one for this review, which came with the incident AI and incident merging already turned on, and added my first monitor.
You can check HTTP(S) endpoints, TCP ports, or plain ping. I pointed an HTTP check at the Uneed homepage and asked it to validate two things: a 2xx status code, and the presence of the word "Uneed" in the page, so a blank page served with a 200 would still count as down. You can assert on headers too. The advanced settings are where you decide how noisy your alerts will be: how many failed checks in a row before an incident opens (three by default), how many successful ones before it closes, and how many regions have to agree that something is wrong.
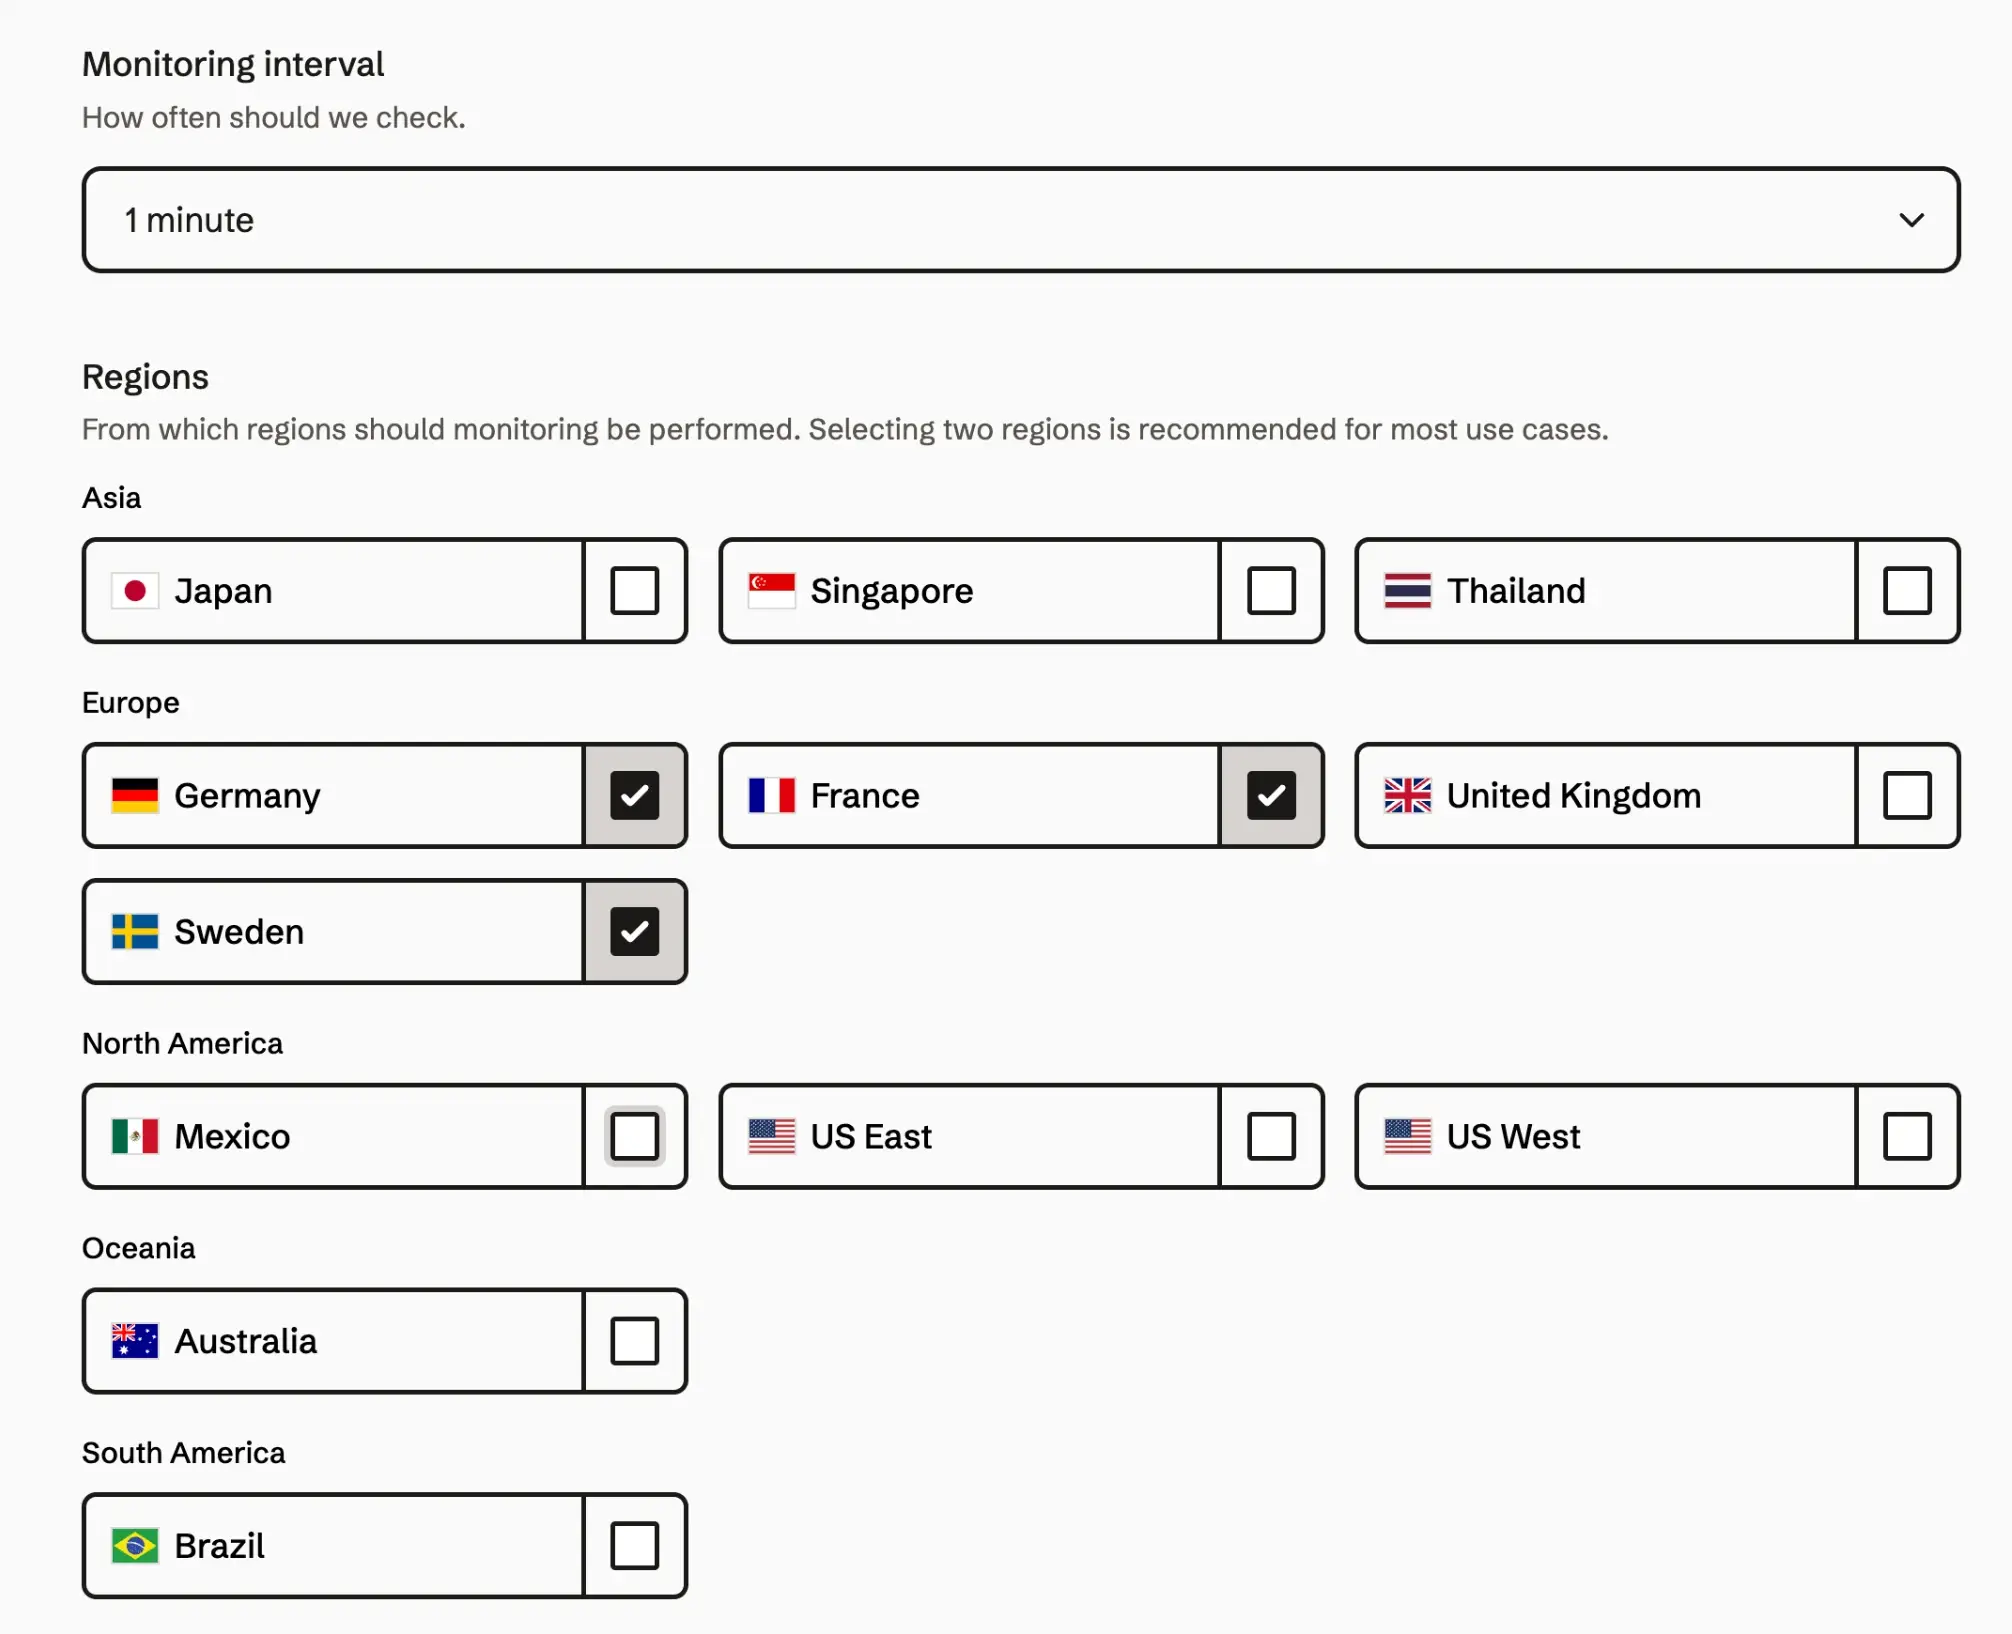
Checks can run anywhere from every 30 seconds to every hour, and the free plan gets the full range. There are 12 monitoring regions, four of them in Europe (Germany, France, the UK and Sweden), the rest spread across Asia, North America, Australia and Brazil.
Picking an interval and monitoring regions when creating a monitor.
A small touch I liked: when I lowered a monitor to a single confirmation to speed up my test, Phare flagged it with a suggestion to go back to three, applicable in one click. It's a small guardrail, but a single confirmation is the setting most likely to page you for a one-off network blip.
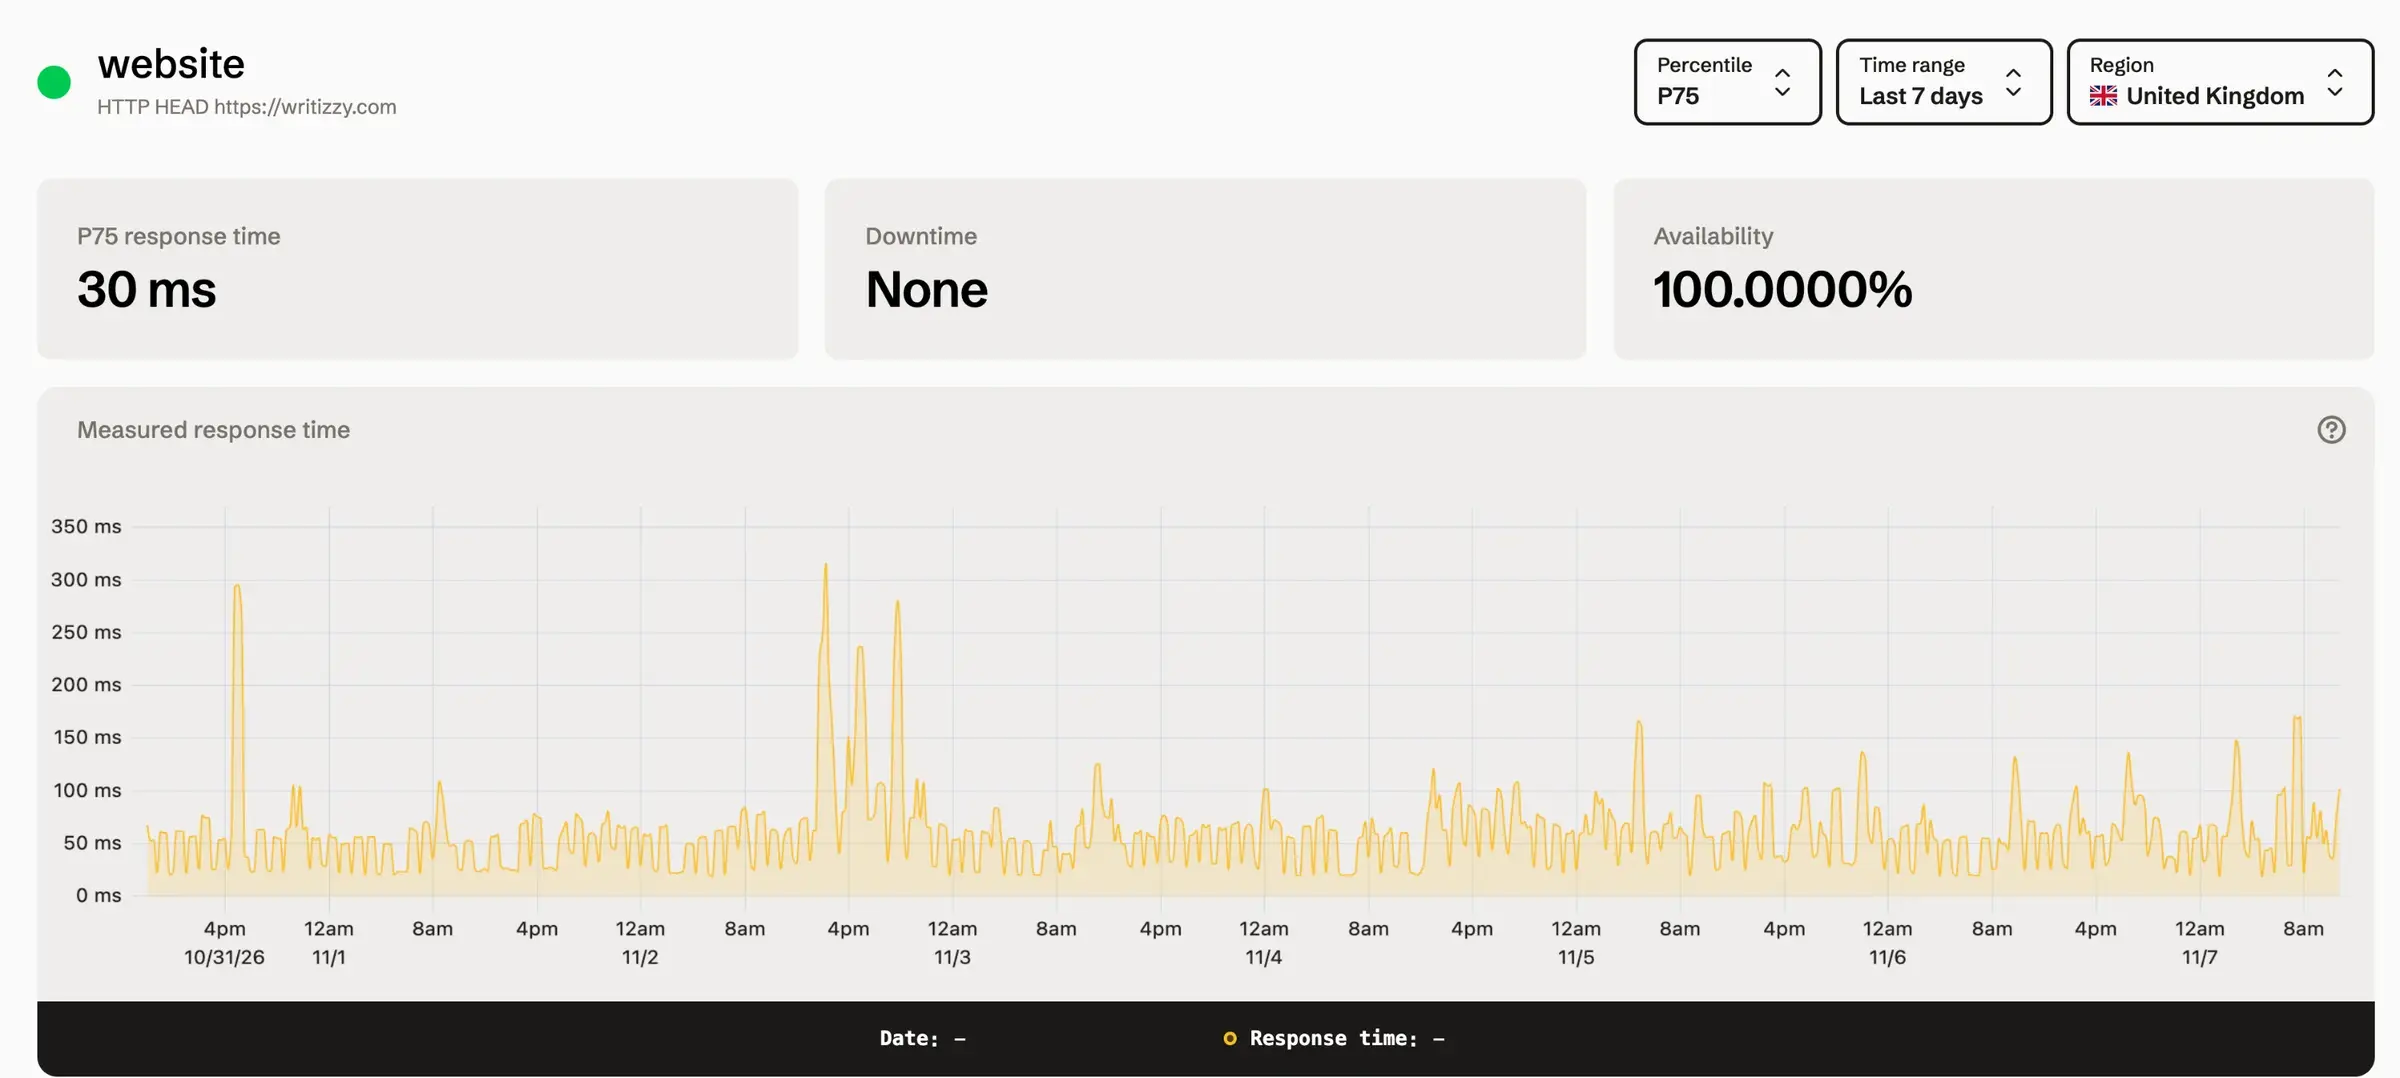
Each monitor gets its own page with response times, downtime and availability, and a chart you can slice by percentile (P75, P90, P99), by region and by period, up to 90 days. On Writizzy's real monitor, the last 7 days from London showed a P75 of 30 ms and no downtime at all.
Writizzy's production monitor over the last 7 days, seen from the United Kingdom.
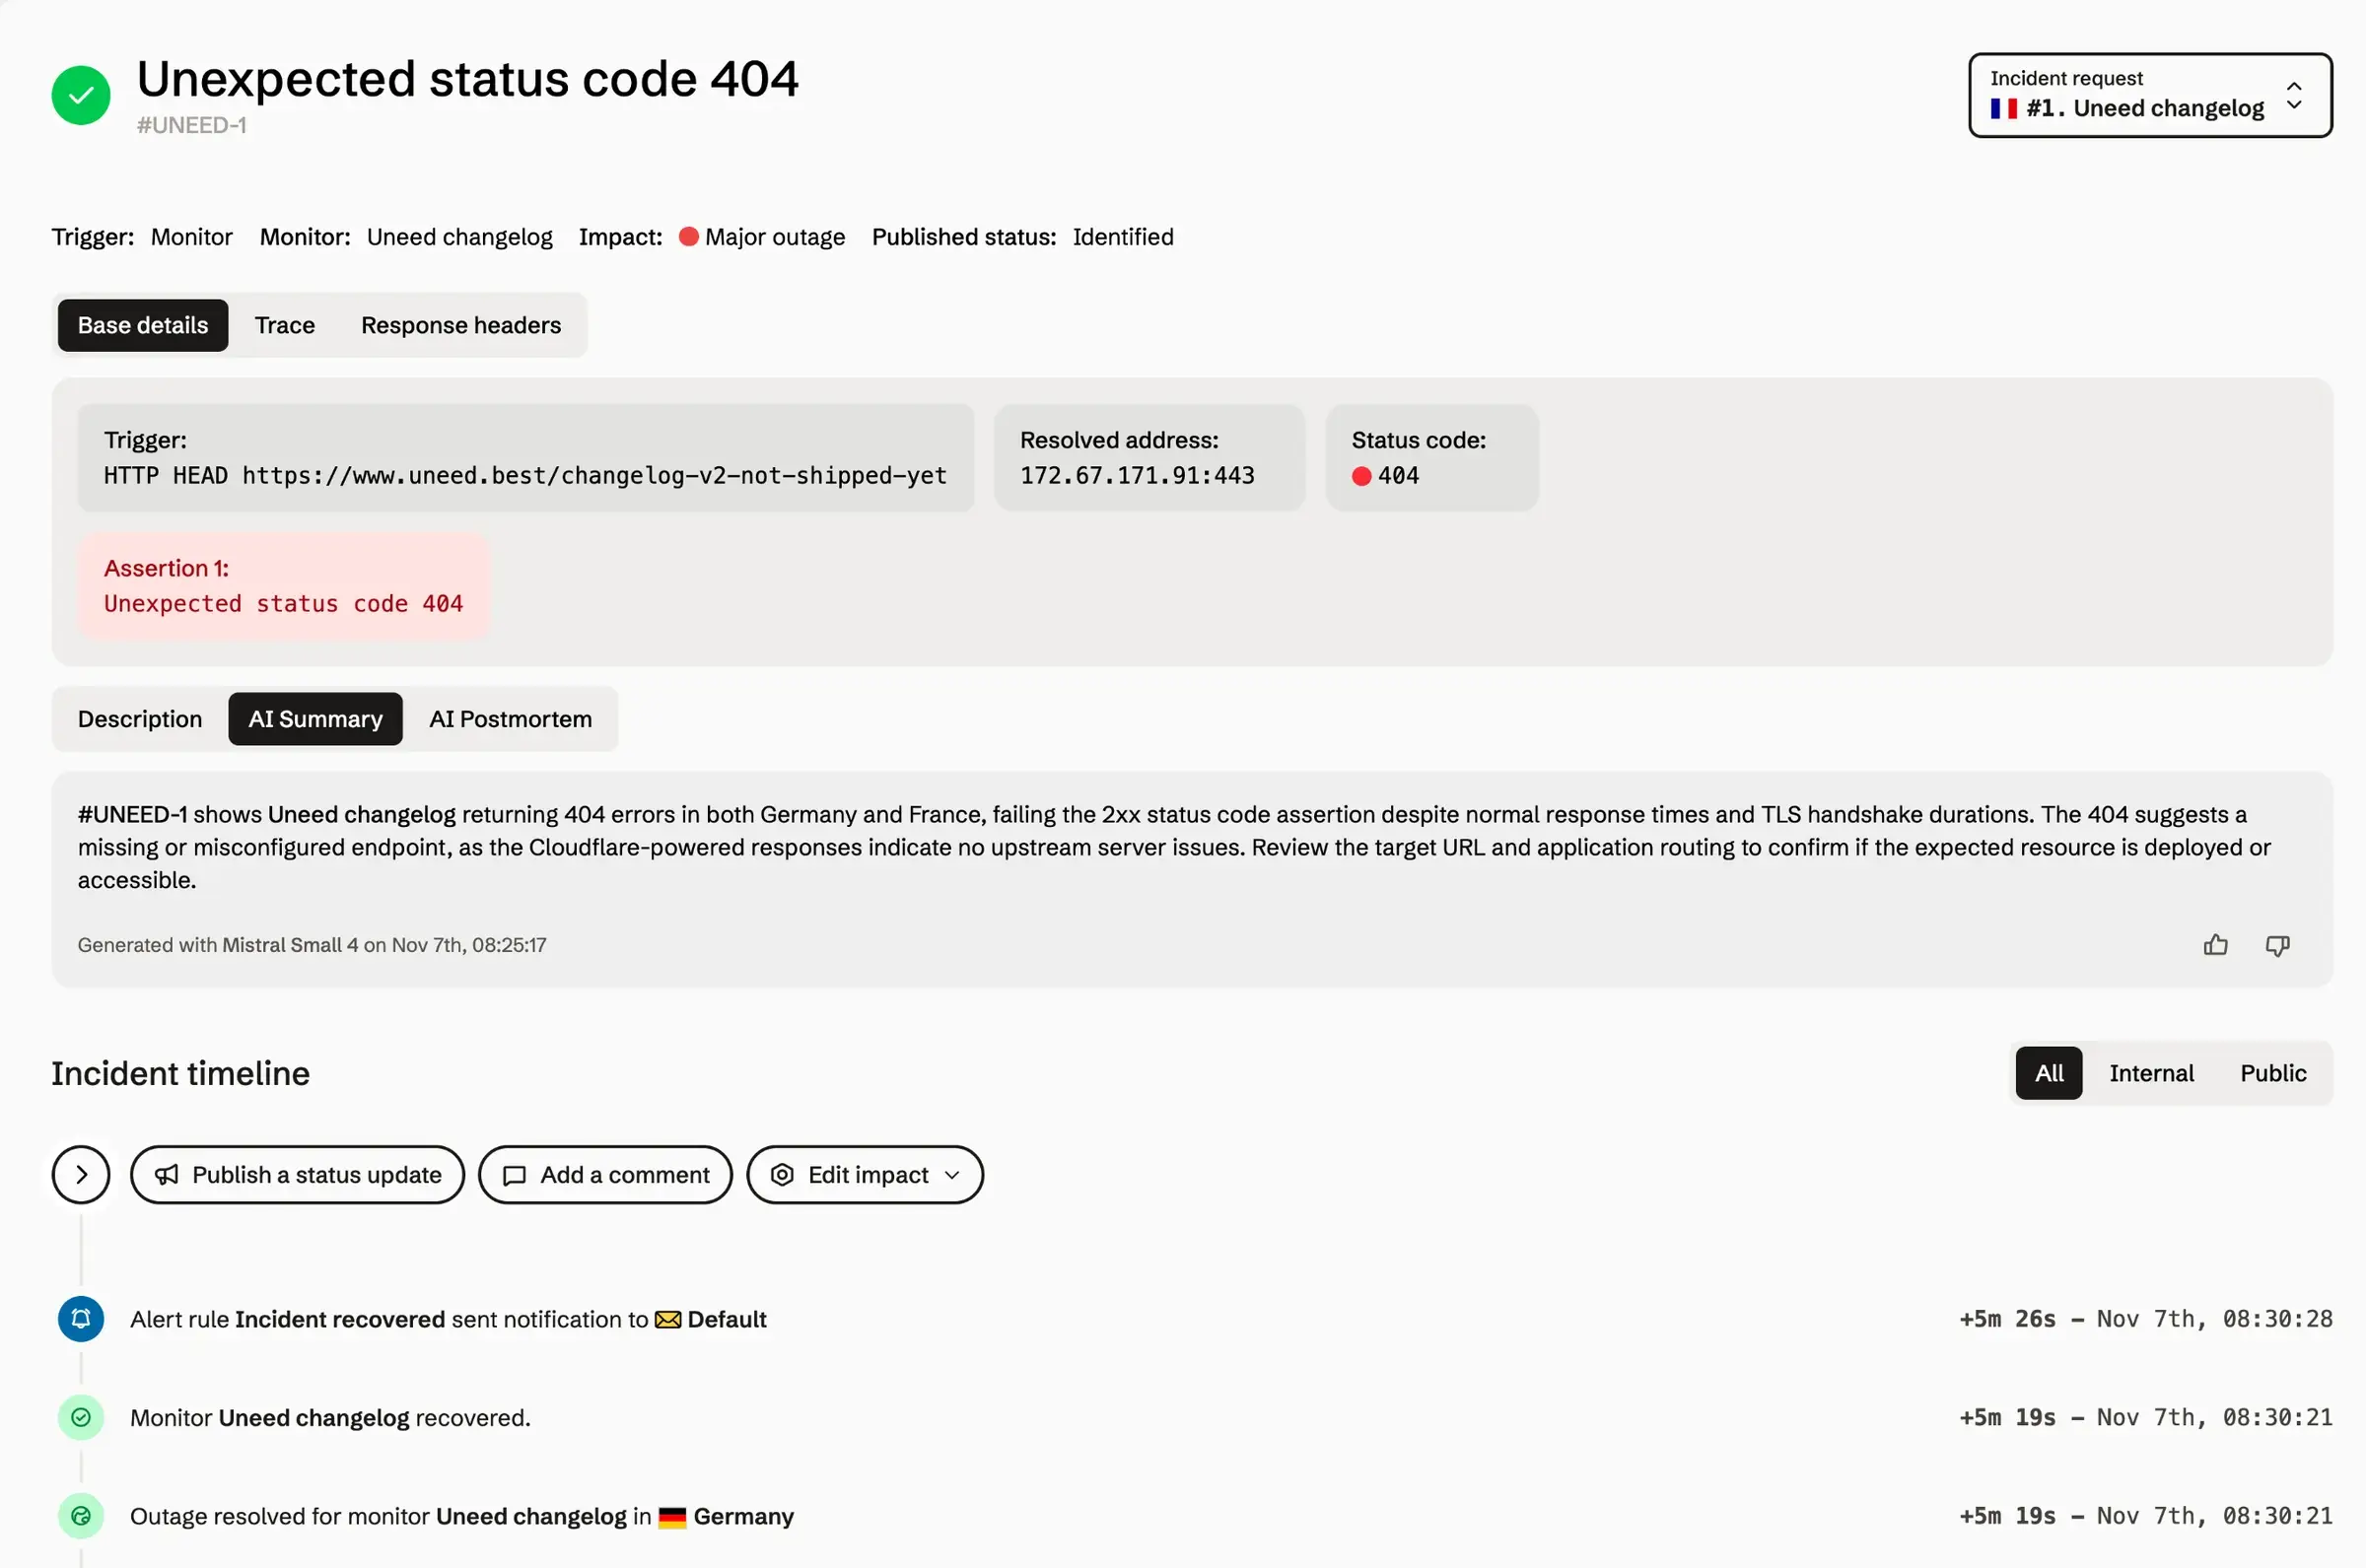
To see what happens when things break, I created a second monitor pointing at a page that doesn't exist on Uneed, checked every minute from France and Germany. Less than a minute later, Phare opened an incident for an unexpected 404 and flagged it as a major outage.
The incident page gives you everything you'd want to debug: the exact request that failed, the resolved IP, the status code and the assertion that broke, plus a trace of the request timings (DNS, TCP, TLS, server time) and the response headers. The timeline shows how the incident unfolded region by region: France detected it first, the alert email left three seconds after the incident was confirmed, and Germany followed 11 seconds later.
The AI summary showed up almost immediately, generated by Mistral. It noticed the 404 in both regions, pointed out that response times were normal, spotted that the responses came from Cloudflare, and suggested checking the URL and the routing. That's exactly the right diagnosis, in plain English, before I had even opened the trace.
The incident page: the failed request, the AI summary and the timeline.
From there I did what you'd do in a real incident: I posted a public update saying we had identified the problem, left an internal note for the team, and fixed the monitor's URL. Even that configuration change landed in the timeline, which is great for a post-incident review.
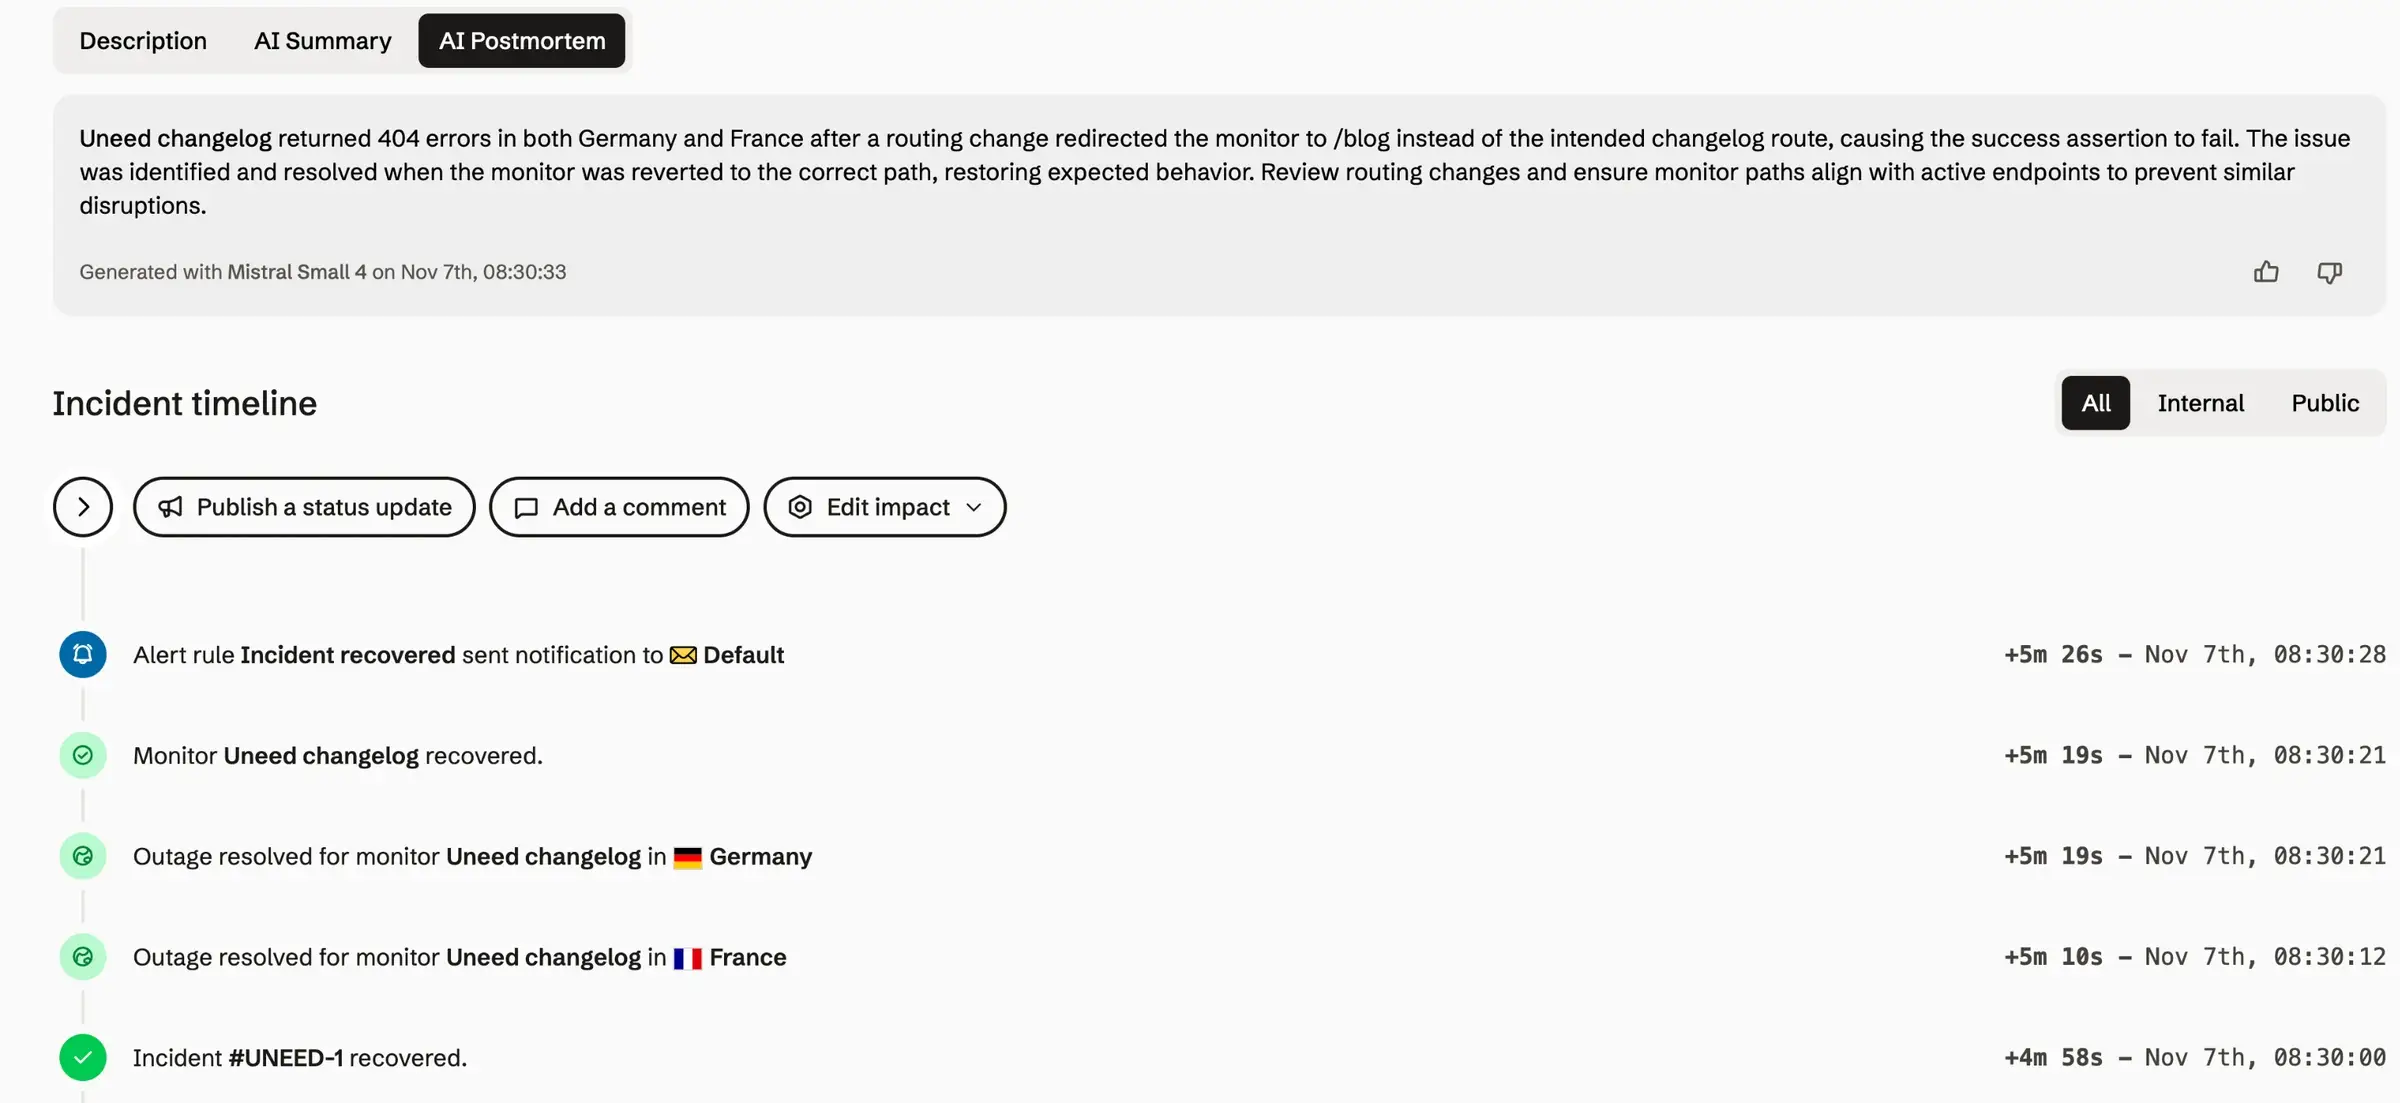
Once the monitor was healthy again, the incident closed by itself, about five minutes after it started, and Phare generated an AI postmortem. This one was less convincing. It claimed that a routing change had sent the monitor to /blog and caused the failure, and that things went back to normal once the monitor was reverted. It was the other way around: the original URL was wrong, and pointing the monitor at /blog is what fixed it. The model clearly mixed up the wording of my public update with the config change. Phare's docs say to review AI output before sharing it, and you can rate each generation. In fairness, a short incident caused by me fiddling with a monitor is a tough case, but I'd treat the postmortem as a first draft, never as the final word.
The same incident after recovery, with the AI postmortem.
Good to know: the AI only runs on incidents opened by monitors, not on manual ones, and each incident in my test used two generations (a summary and a postmortem). The free plan's 10 generations therefore cover about five automatic incidents a month.
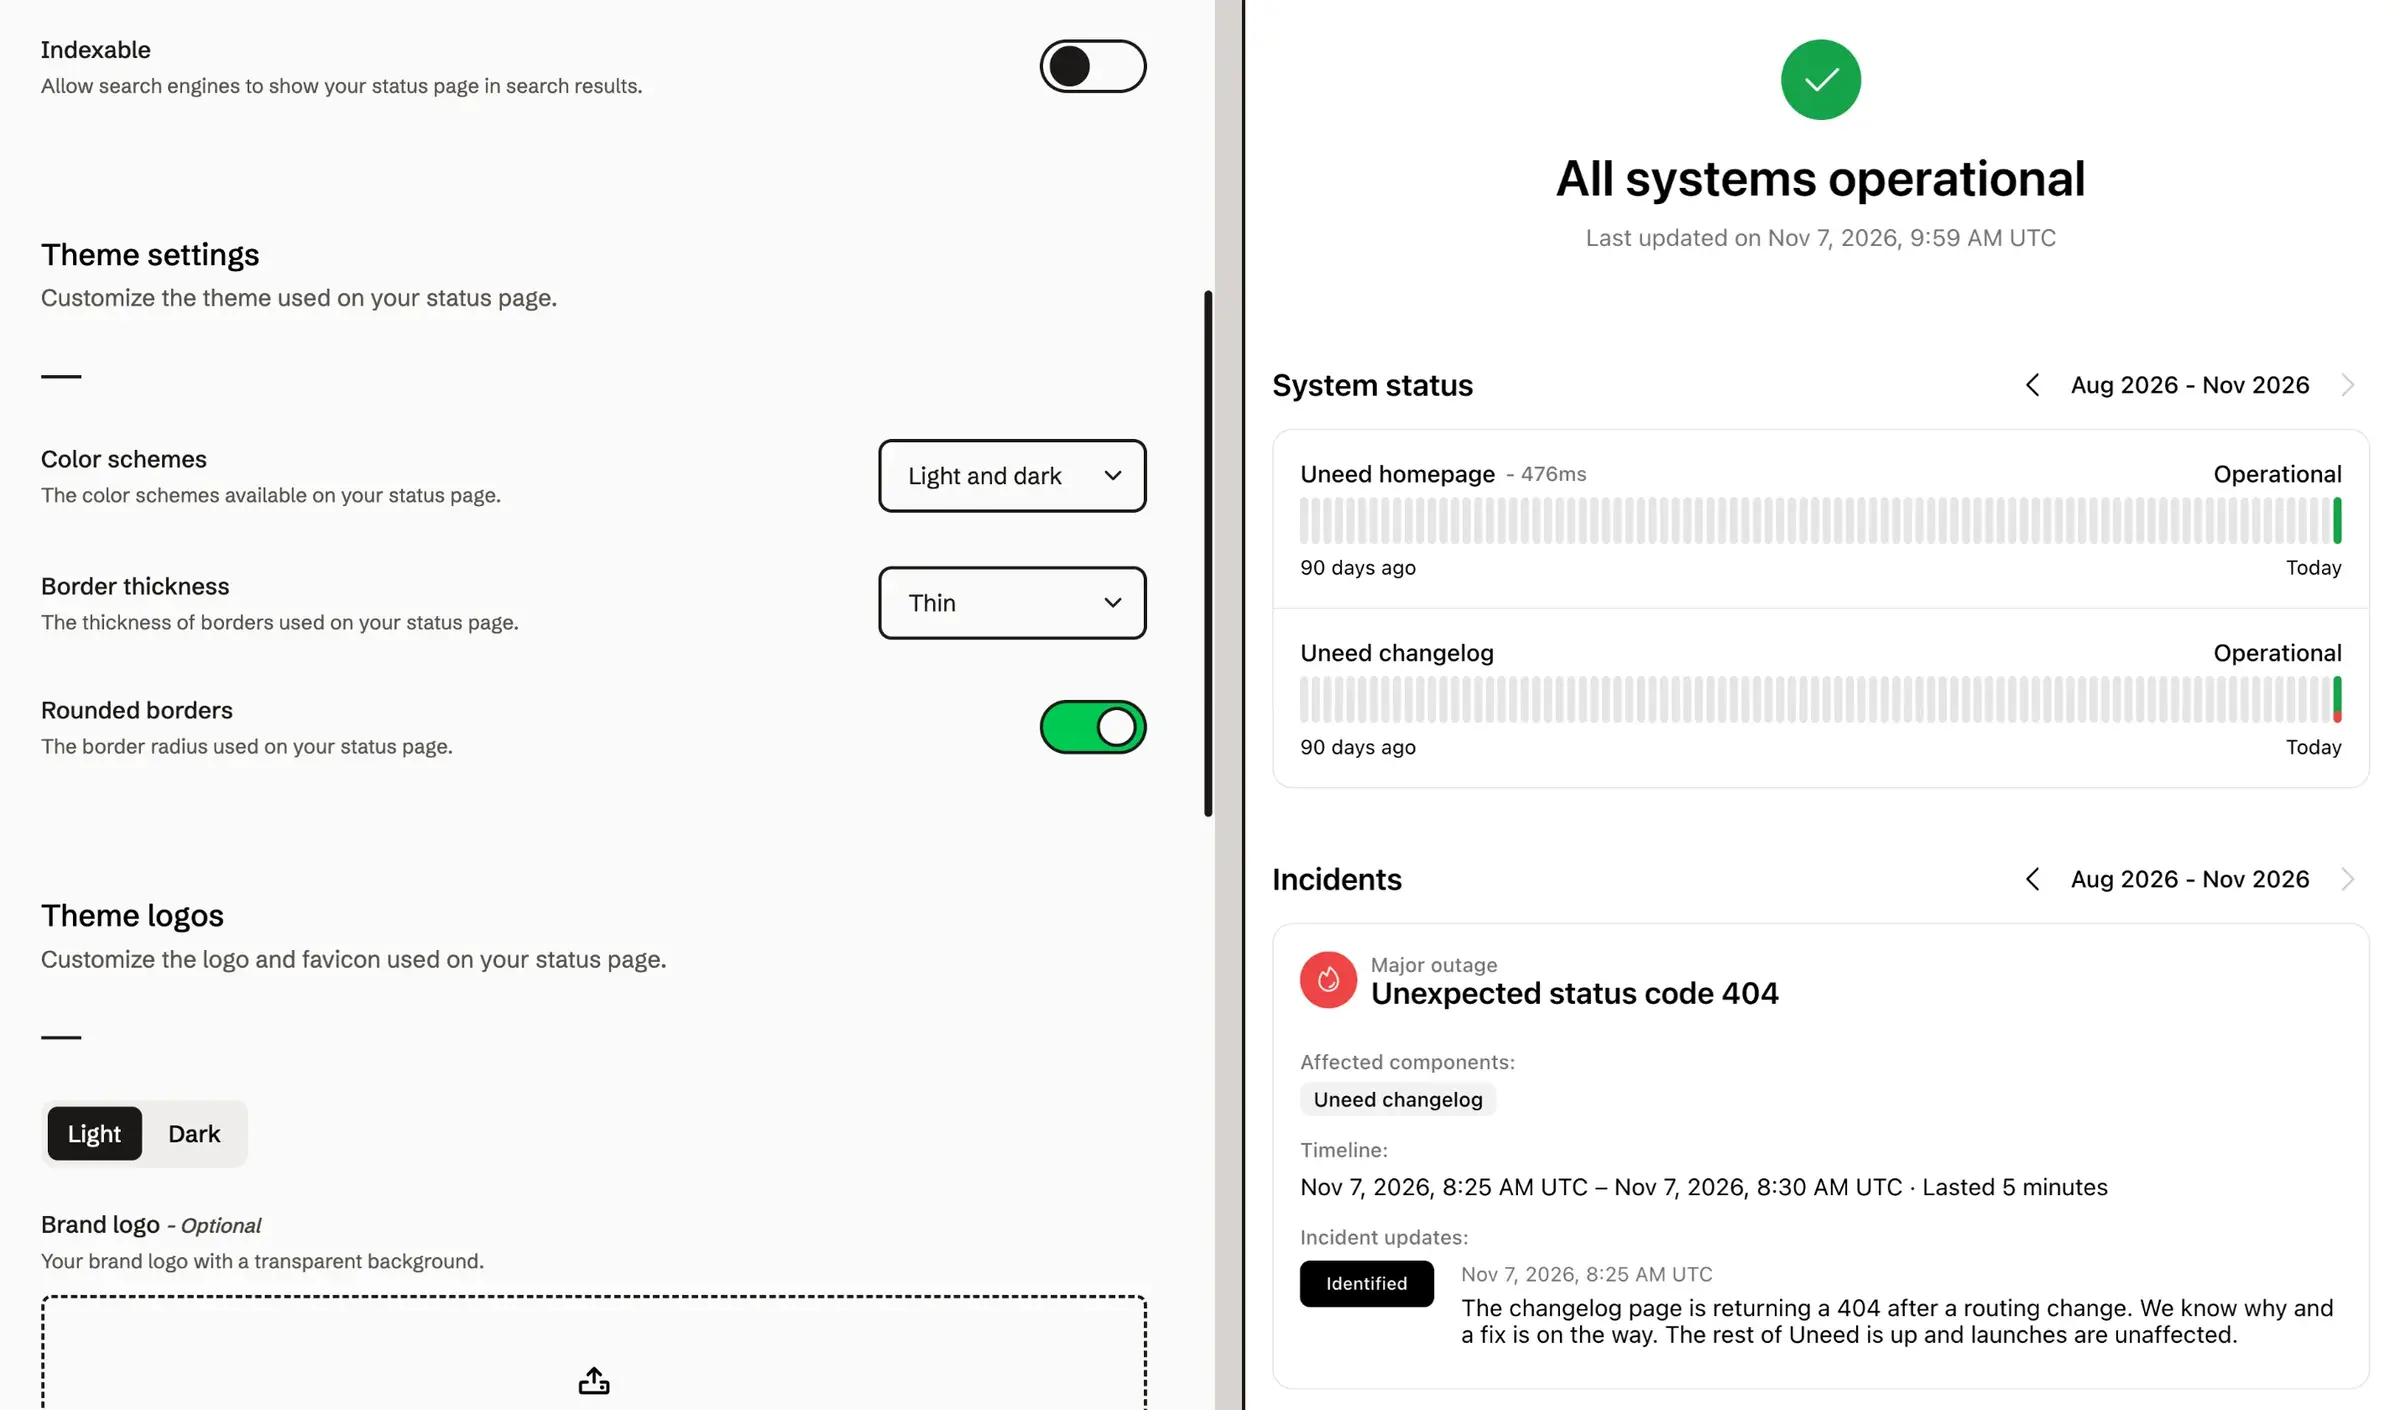
The status page editor is the part of Phare I enjoyed the most. You fill in the form on the left and watch the page change on the right as you type.
Every page gets a free Phare subdomain, and you can plug in your own domain with a CNAME record, on the free plan too. Branding goes further than I expected: separate logos and favicons for light and dark mode, border styles, and every color of the page, including the ones for each incident level. You choose which monitors or groups of monitors appear, whether to show response times, and how much history to display (30, 60 or 90 days). Visitors can follow updates through RSS, Atom or Slack. Password, token or IP-restricted pages are reserved to the paid plan.
The status page editor, with the live preview on the right.
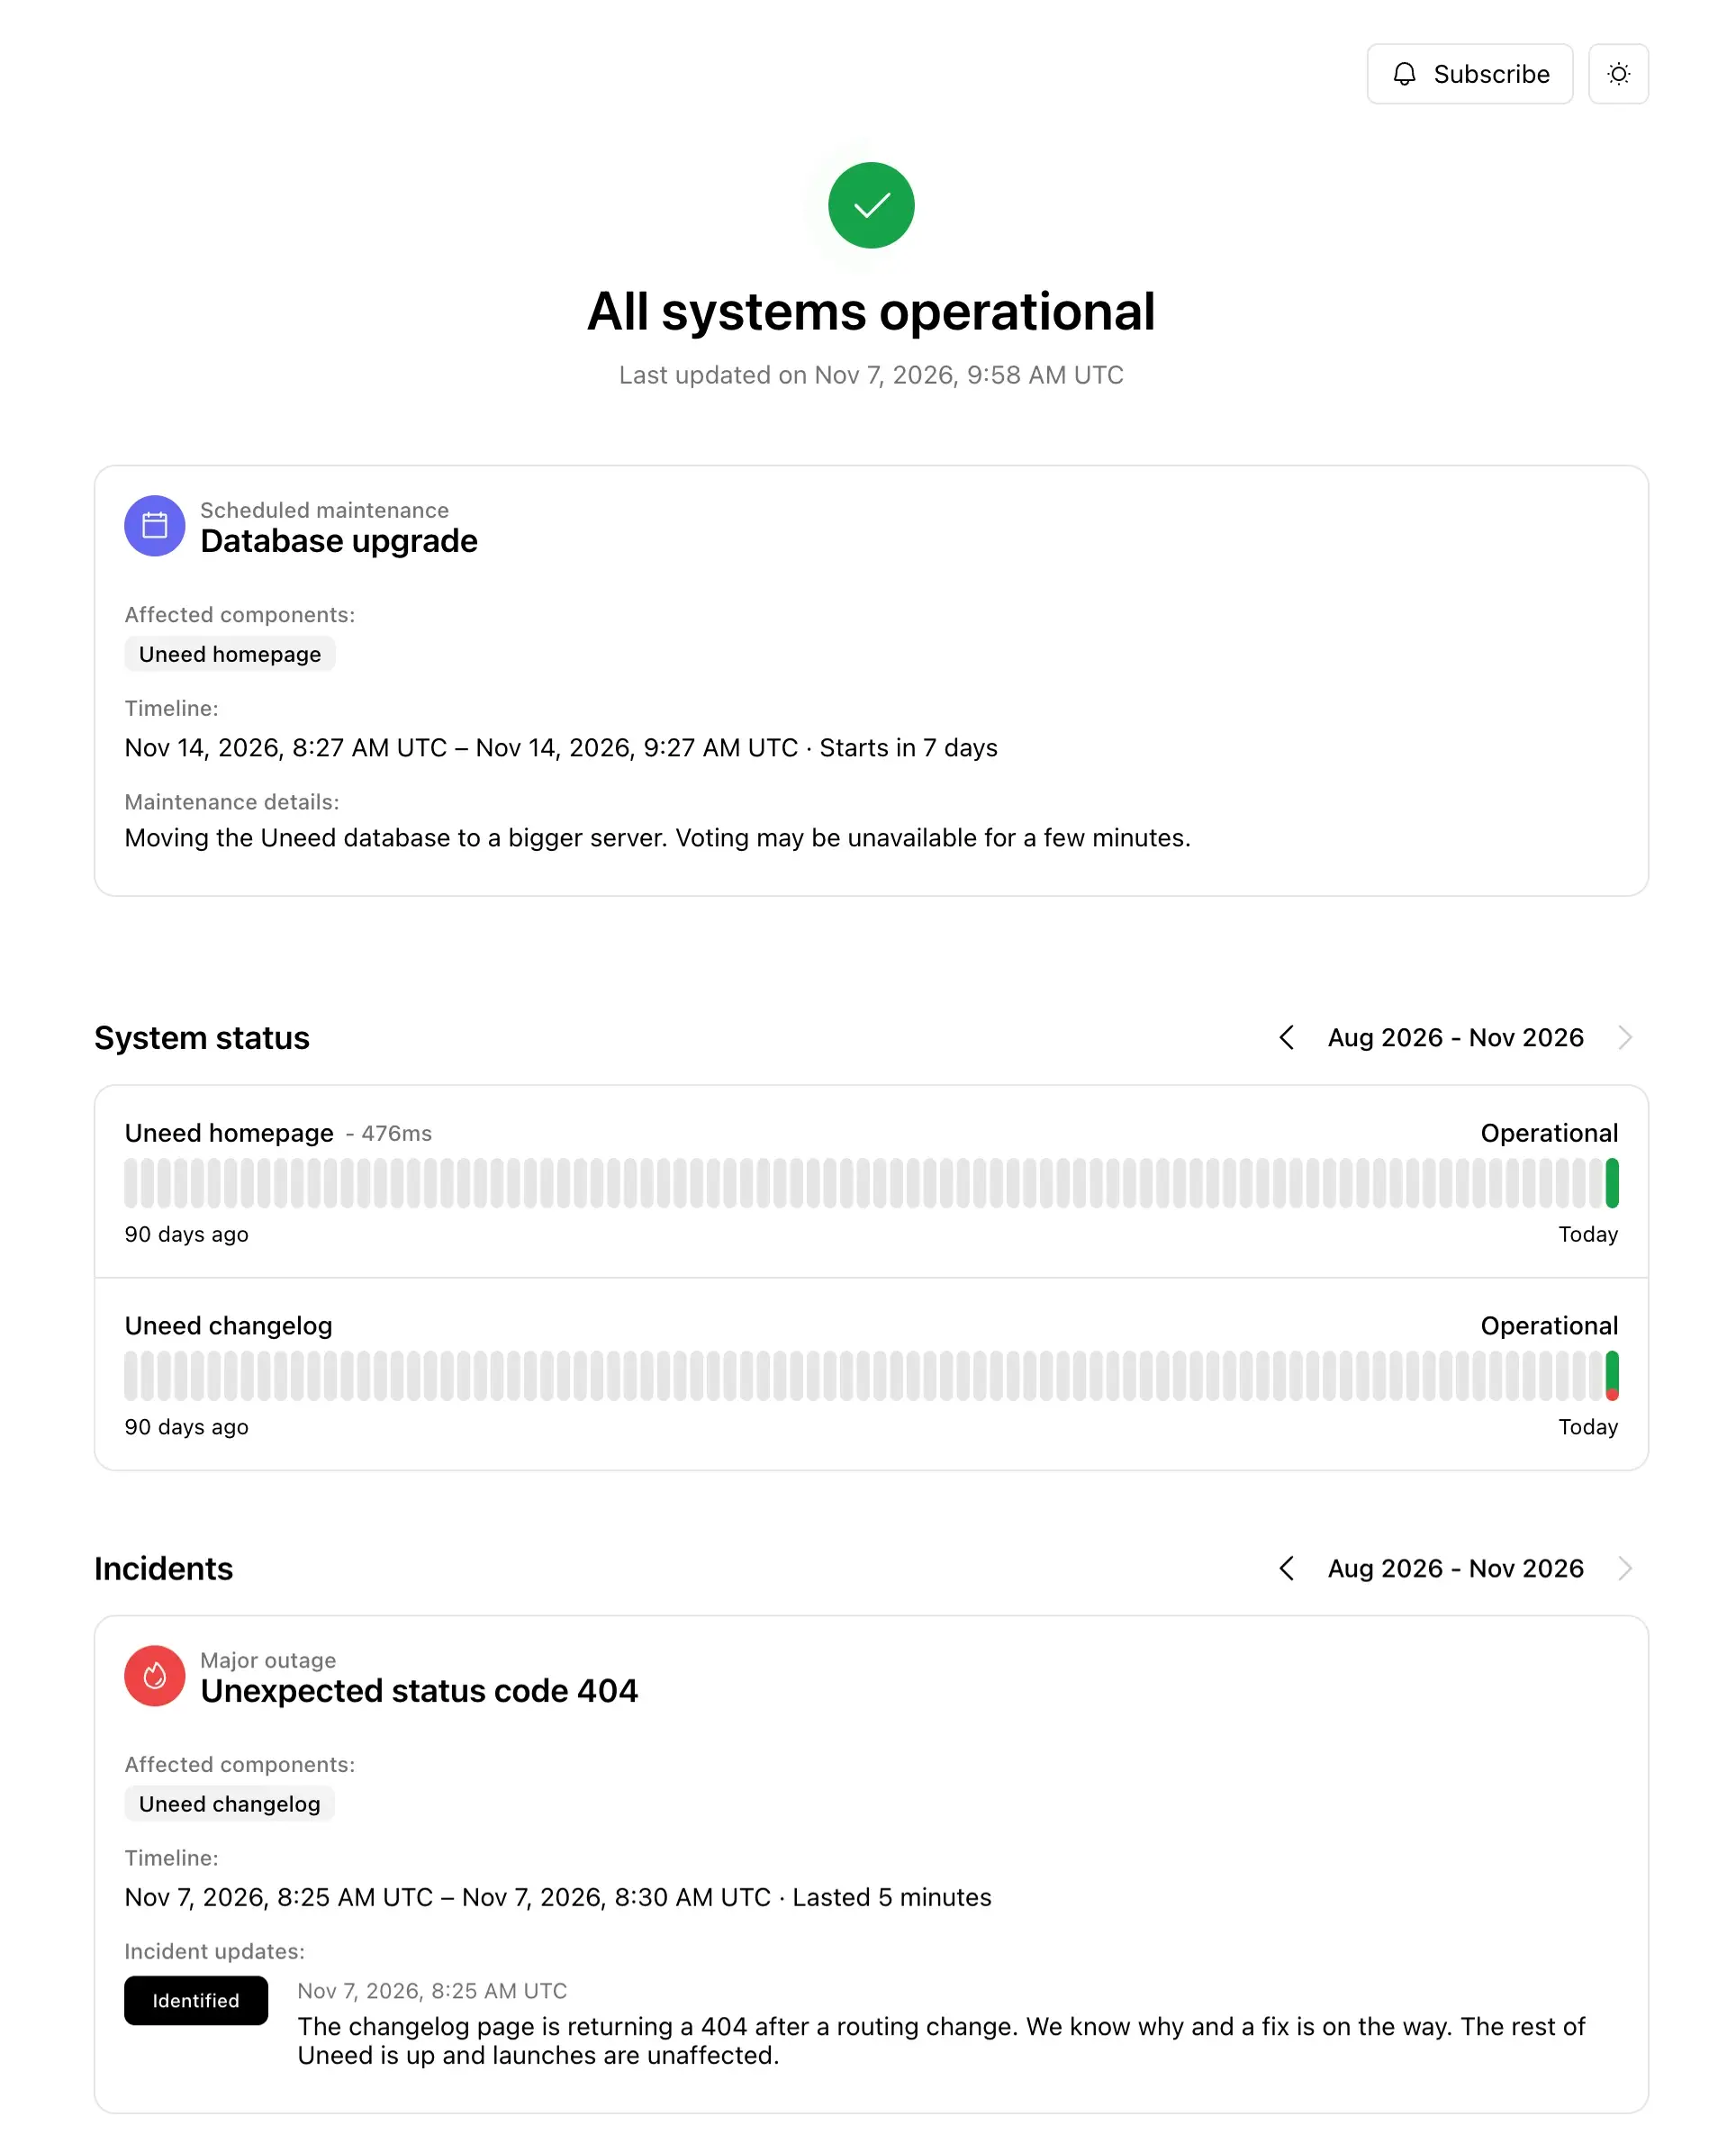
During my incident, the public page switched to an ongoing major outage, with my update right under it. Once it was over, it went back to all green and kept the incident in its history, with its five-minute duration. Visitors can switch between light and dark mode. The result is clean and fast, and nothing about it gives away that it comes from a free plan.
The public status page after the incident, with the upcoming maintenance announced.
Two limits I noticed. Visitors can't subscribe by email, only through feeds, and the docs suggest a feed-to-email service if you need it. And when the incident recovered on its own, the last public update still said the issue was identified, because I hadn't posted a resolution message myself. The page did show when the incident ended, so nobody would be misled, but it's worth remembering to close the loop.
I also scheduled a database upgrade a week out, which took a few seconds thanks to date presets. During a maintenance window you can pause the affected monitors, keep them running but mute the alerts, or change nothing at all. The maintenance showed up on the status page right away, with a countdown to its start.
Alert channels: email, Slack, Discord, Telegram, Pushover, Ntfy, ilert and outgoing webhooks, plus SMS and voice on the paid plan.
Alert rules: you pick which events notify whom (monitor changes, certificates, every step of an incident, maintenance windows), for one project or the whole organization, with rate limiting to avoid spam.
SSL certificates: unlimited certificate monitoring, with alerts on discovery and before expiry.
Developer tooling: a REST API, a Terraform provider, community Ansible and NixOS modules, and API keys with read or write access set resource by resource.
Teams: unlimited members on every plan, read-only and responder roles, and single sign-on (Okta, Entra ID, Google Workspace) on the paid plan.
Shipping pace: the 2026 changelog alone has around 40 entries, from ping monitoring to tags and more detailed incidents on status pages.
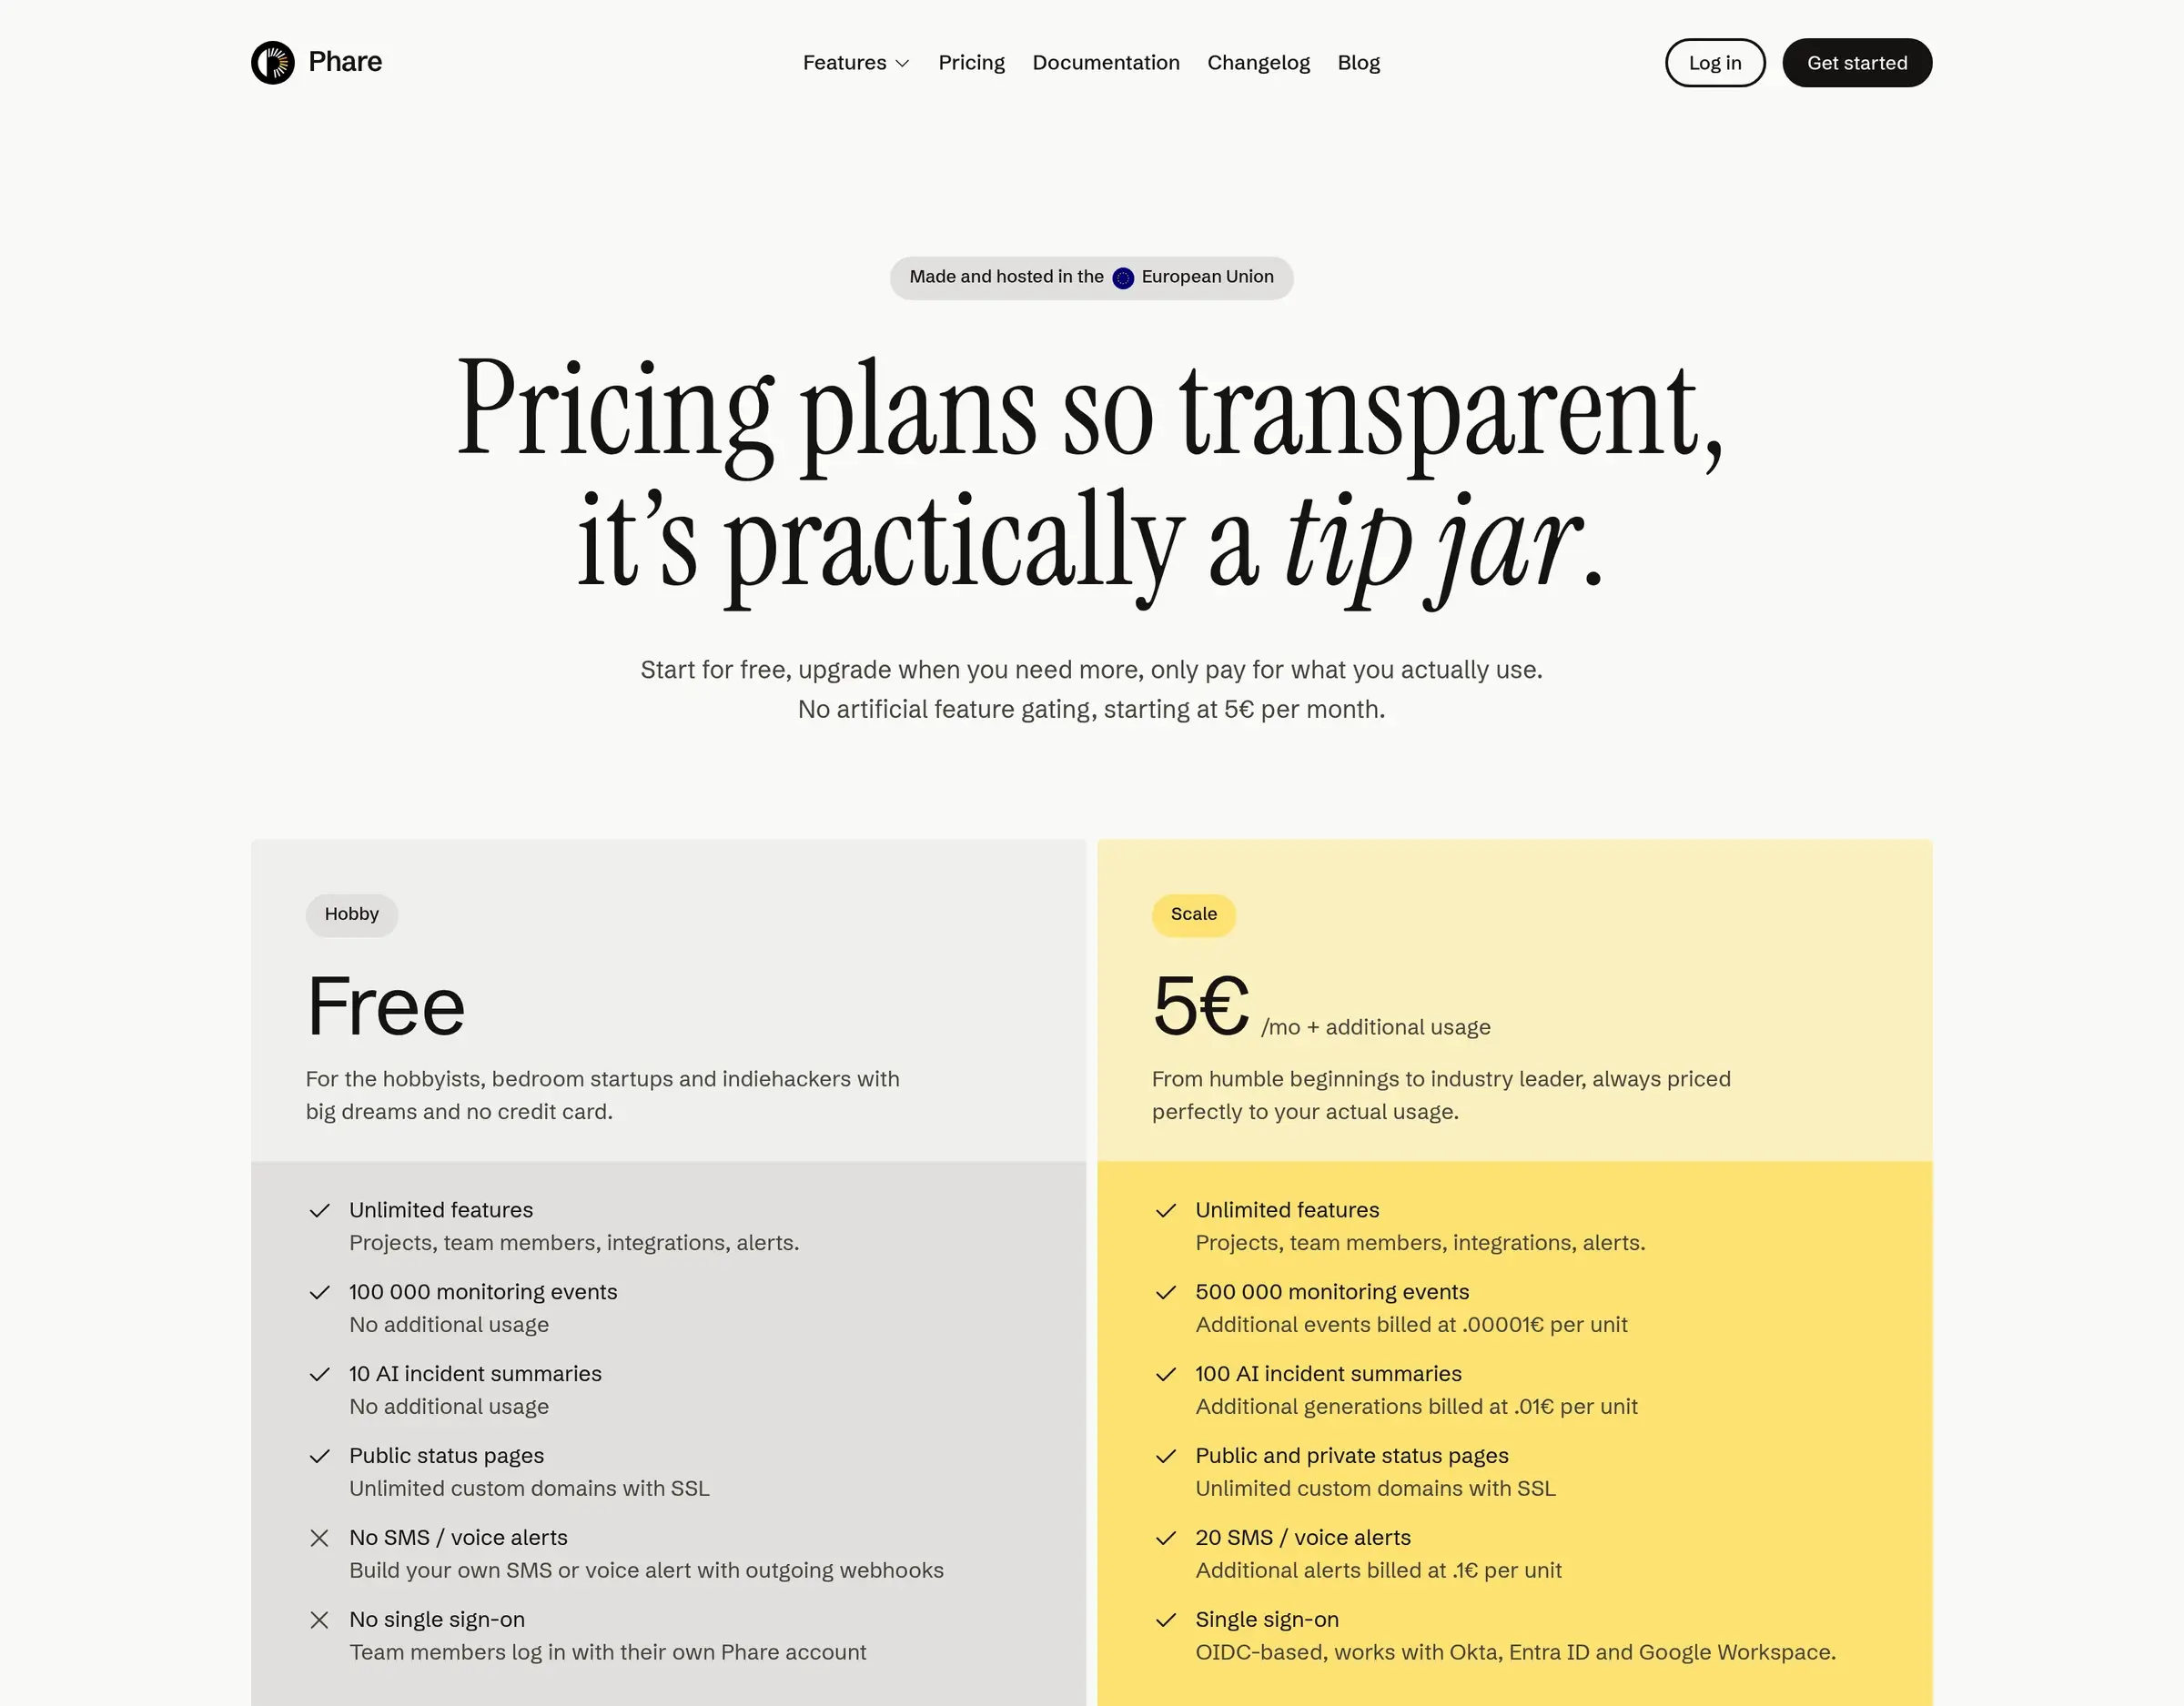
Phare's pricing is usage-based and transparent, with a published price for every unit. Prices are in euros, excluding taxes.
Plan
Price
Monitoring events / month
AI generations / month
SMS / voice alerts
Status pages
SSO
Hobby
Free
100,000
10
Not included
Public, unlimited custom domains
No
Scale
€5/month + usage
500,000, then €0.00001 each
100, then €0.01 each
20, then €0.10 each
Public and private
Yes
Larger companies can add an Enterprise option on top of Scale, with custom SLAs, volume discounts, monthly to annual commitments, SEPA direct debit and a dedicated support channel.
Phare's pricing page: a free Hobby plan and the Scale plan at 5€ per month plus usage.
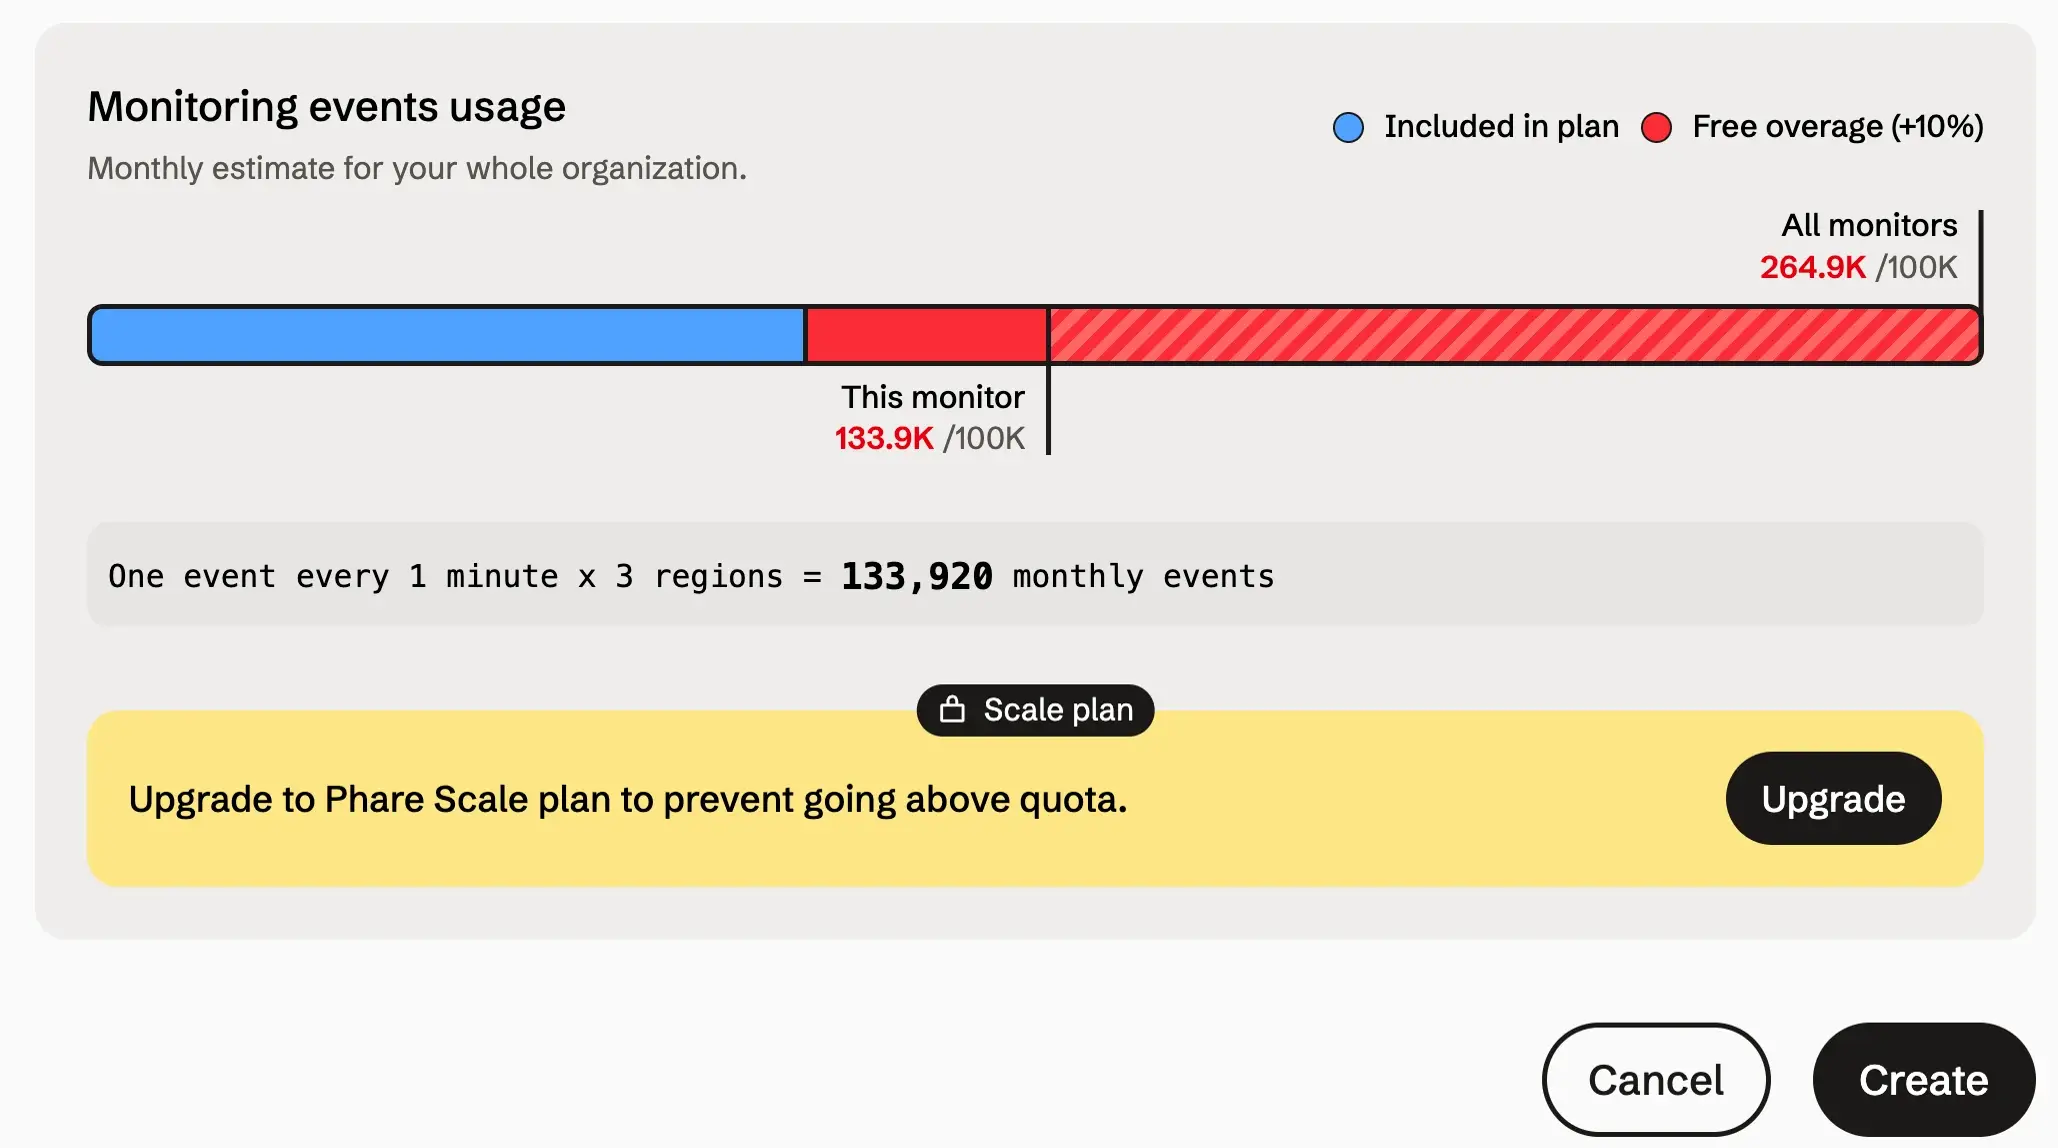
The unit that matters is the monitoring event: one check, from one region. The good news is that you never have to do the math yourself, because the monitor form shows how much of your monthly quota each monitor will use before you save it. One check every minute from 3 regions comes to 133,920 events a month. One check every 5 minutes from 2 regions comes to 17,856, so the free plan fits about five monitors at that pace.
The quota estimate shown before saving a monitor.
On Scale, extra events cost €1 per 100,000. Ten monitors checked every minute from 3 regions would add up to about 1.34 million events, which means €5 plus roughly €8.39 of usage, so around €13.39 a month. You set your own additional quotas, which act as a ceiling on the invoice. Both plans also get a 10% buffer above their quota, and Phare emails you before you start using it and again before it runs out. Once that buffer is gone, monitoring pauses until the next billing period. On Scale you can raise your quota to avoid that, but the free plan has no extra usage at all, so a Hobby account that overshoots simply stops checking.
European SaaS teams who need a clean GDPR story, with EU subprocessors and a published DPA
Small teams and side projects that want a free plan with unlimited projects, members and status pages
Teams that want monitoring, incident communication and a status page in one tool instead of three
Anyone managing infrastructure as code, thanks to the API and the Terraform provider
Phare is not the right fit for everyone, though. Monitors are limited to HTTP(S), TCP and ping, so there's no heartbeat monitoring for cron jobs and no browser-based transaction checks. And if you rely on PagerDuty, Opsgenie or Microsoft Teams, there's no native integration: you'll be going through webhooks or ilert.
A note for teams behind strict firewalls: checks come from shared Bunny.net IP ranges rather than fixed addresses. That used to mean asking for the private agent Phare offers on request, but Phare now signs its requests with Web Bot Auth and is listed in Cloudflare's bot directory, so you can let its traffic through safely even without dedicated IPs.
If you're comparing Phare with Better Stack, Hyperping, Oh Dear or OpenStatus, the main structural difference is the billing model: most of them sell plans by number of monitors or sites, while Phare charges for the checks you actually run. That rewards teams who tune their intervals and regions, and it can surprise the ones who don't.
Phare does the essentials of uptime monitoring very well, and adds a few things I didn't expect at this price: a live quota estimate on every monitor, incident pages with real debugging detail, and the nicest status page editor I've used. The European angle is real and documented, from the servers to the AI model. For a tool that starts free and costs €5 a month after that, it's an easy recommendation.
What I liked:
A stack that stays in Europe, with named providers (Hetzner, Bunny.net, Scaleway, Mistral) and a published DPA
The quota estimate on every monitor, which makes usage-based pricing predictable
Incident pages with request timings, per-region events and logged config changes
An AI summary that got the diagnosis right within seconds
A status page editor with live preview, and an A+ rated, featherweight public page
A free plan that's genuinely usable, 30-second checks included
Public revenue, costs and usage numbers
Things to keep in mind:
Treat the AI postmortem as a draft: in my test it got cause and fix backwards
No native PagerDuty, Opsgenie or Microsoft Teams integration, only webhooks or ilert
No heartbeat or browser checks, only HTTP(S), TCP and ping
On the free plan, going past the quota and its 10% buffer pauses monitoring until the next period
If you want uptime monitoring and status pages that never leave the EU, Phare is worth setting up this afternoon.
Asin Review - An Amazon Price Tracker You Pay Per Check
We've tested Asin, an Amazon price tracker that checks products on 11 Amazon stores, keeps every price it reads, and emails you on drops, target prices and restocks, with a REST API and an MCP server on top.
Reviews
Orka Review - Live Chat for SaaS Founders Running Several Products
We've tested Orka, a live chat for SaaS founders that puts every product you run in one support inbox, with an AI that runs on your own API key.
Reviews
Talanoa Review - A Local Email Client That Reads Like a Chat
We've tested Talanoa, a local email client for macOS, Windows and Linux that groups your mail by person, shows threads as chat bubbles, and runs its AI on your own computer.
Reviews
BlogSEO Review - SEO Automation That Writes, Benchmarks and Builds Links
We've tested BlogSEO, an SEO automation tool that researches keywords, writes and publishes blog articles, trades backlinks through a non-reciprocal network and lets Claude or ChatGPT run it over MCP.
We use cookies
Essential and analytics cookies keep Uneed running and help us understand usage, and a referral cookie credits the partner who sent you. Marketing cookies are optional. Privacy policy